Internal High-Stake Strategic Deck with Advanced Animation
Strategy isn’t a deck. It’s a data-fueled engine. For OPMG, I was brought in to clarify and visualize their most complex capability stack for a C-level audience — without losing the intelligence behind it.

Internal High-Stake Strategic Deck with Advanced Animation
The Ask
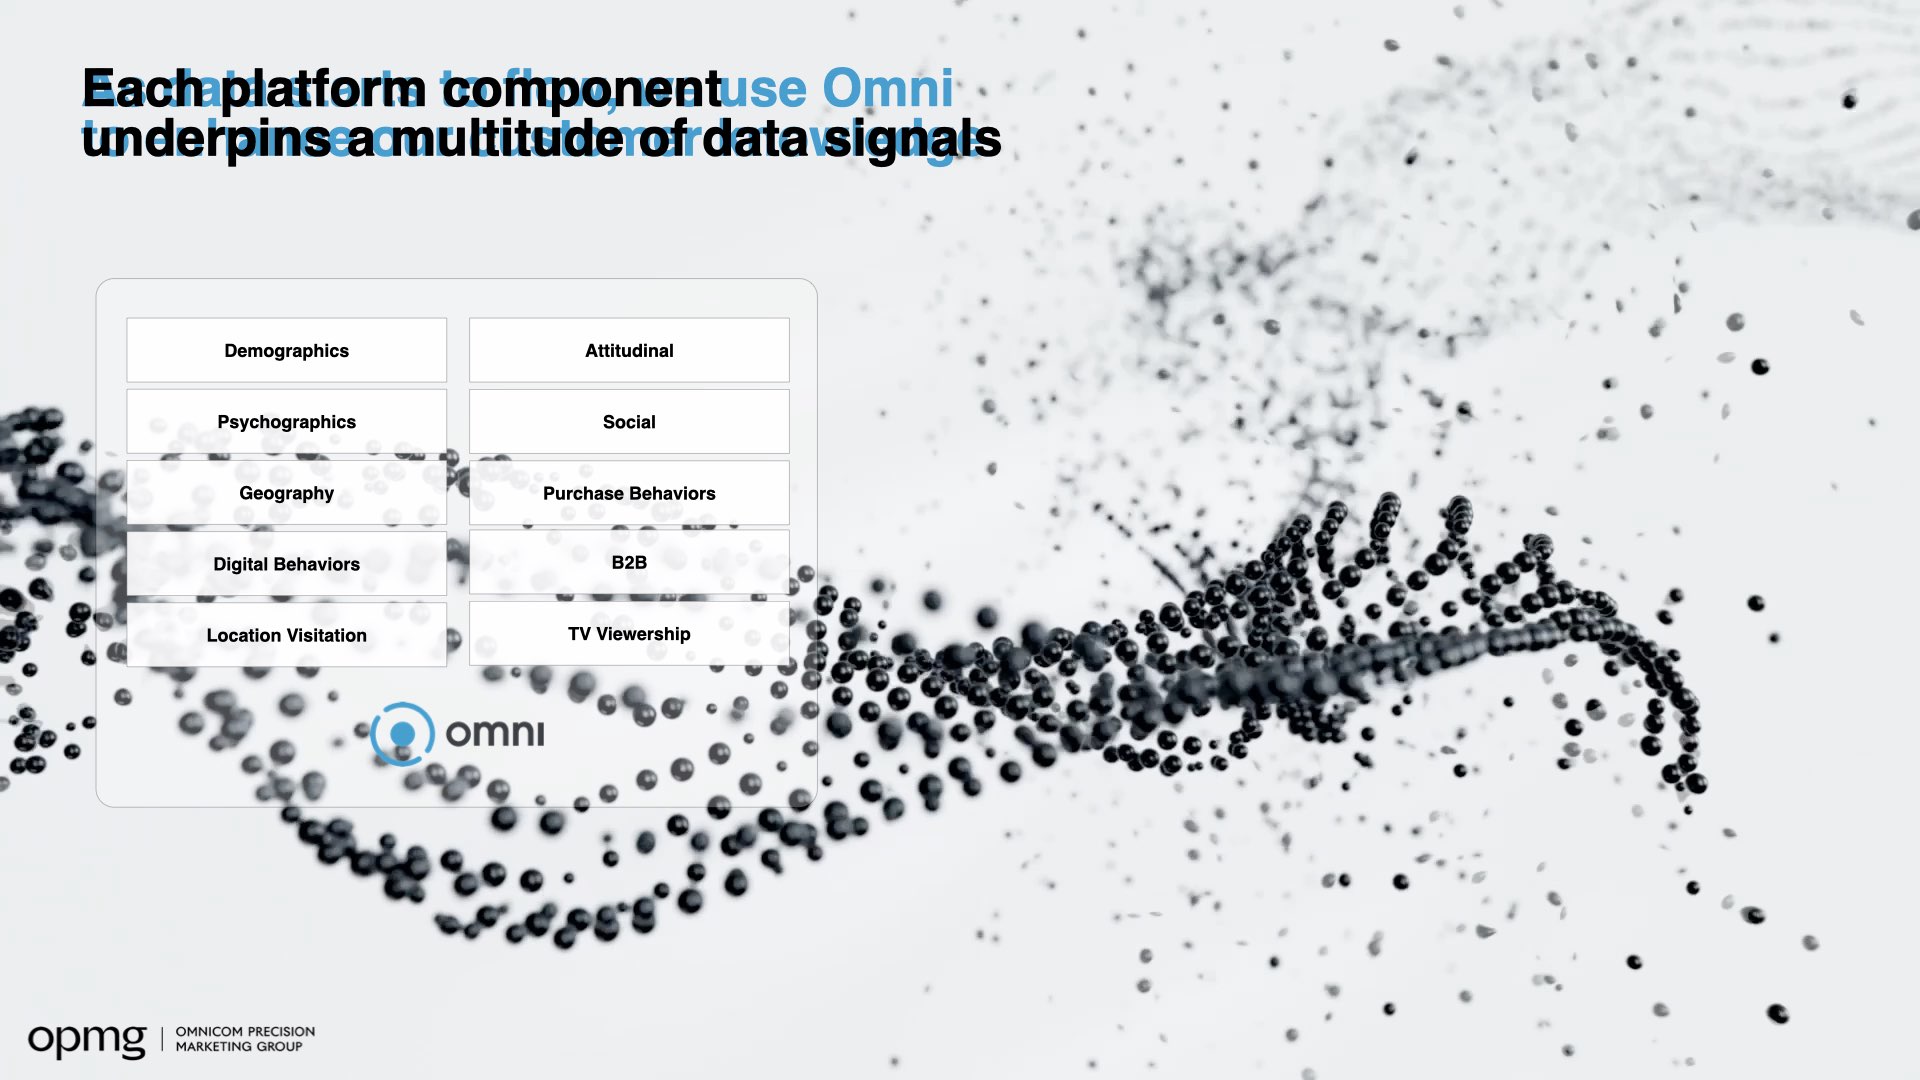
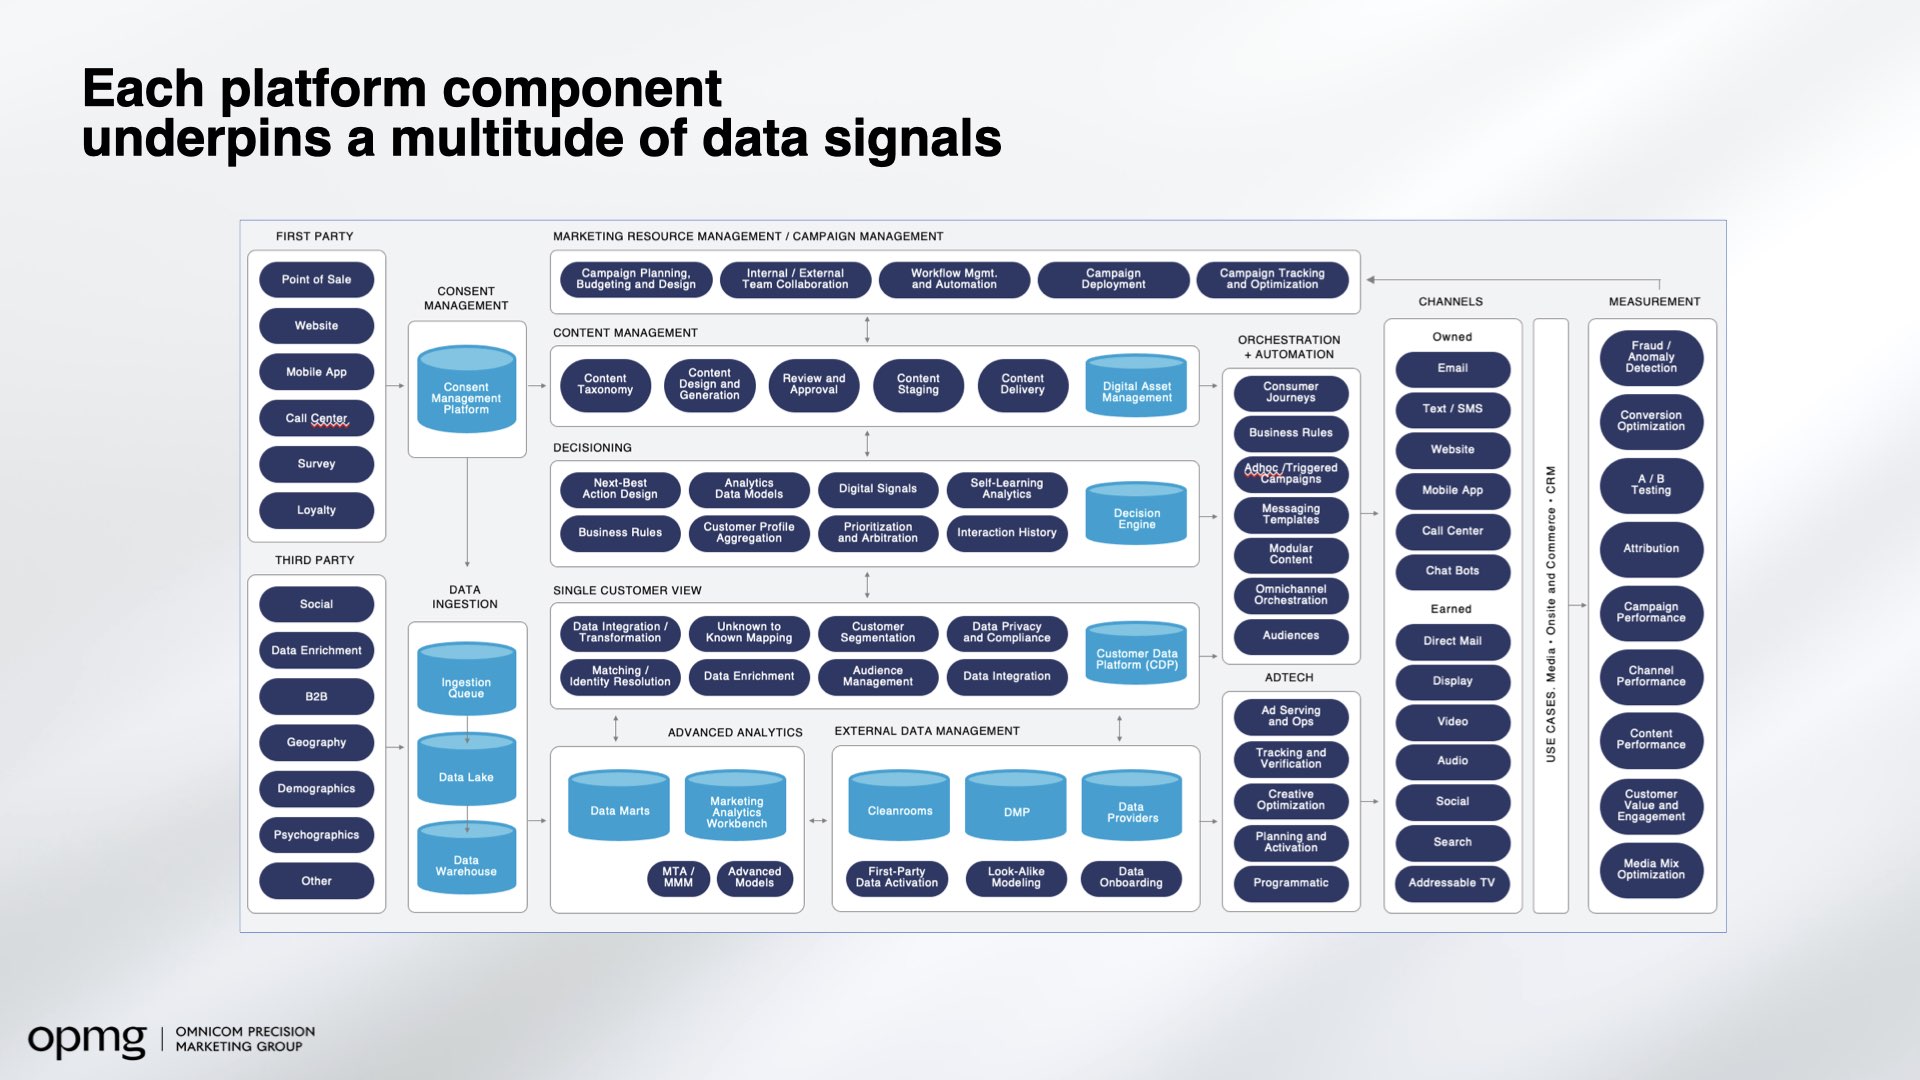
I was responsible for the most advanced and structurally critical section of the deck: illustrating how data signals across touchpoints are captured, modeled, enriched, and applied to drive business actions.
The Challenge
Think: from data ingestion to customer decisioning, in a language the CMO, CTO, and CRO could all align on.
Internal High-Stake Strategic Deck with Advanced Animation
The Solution
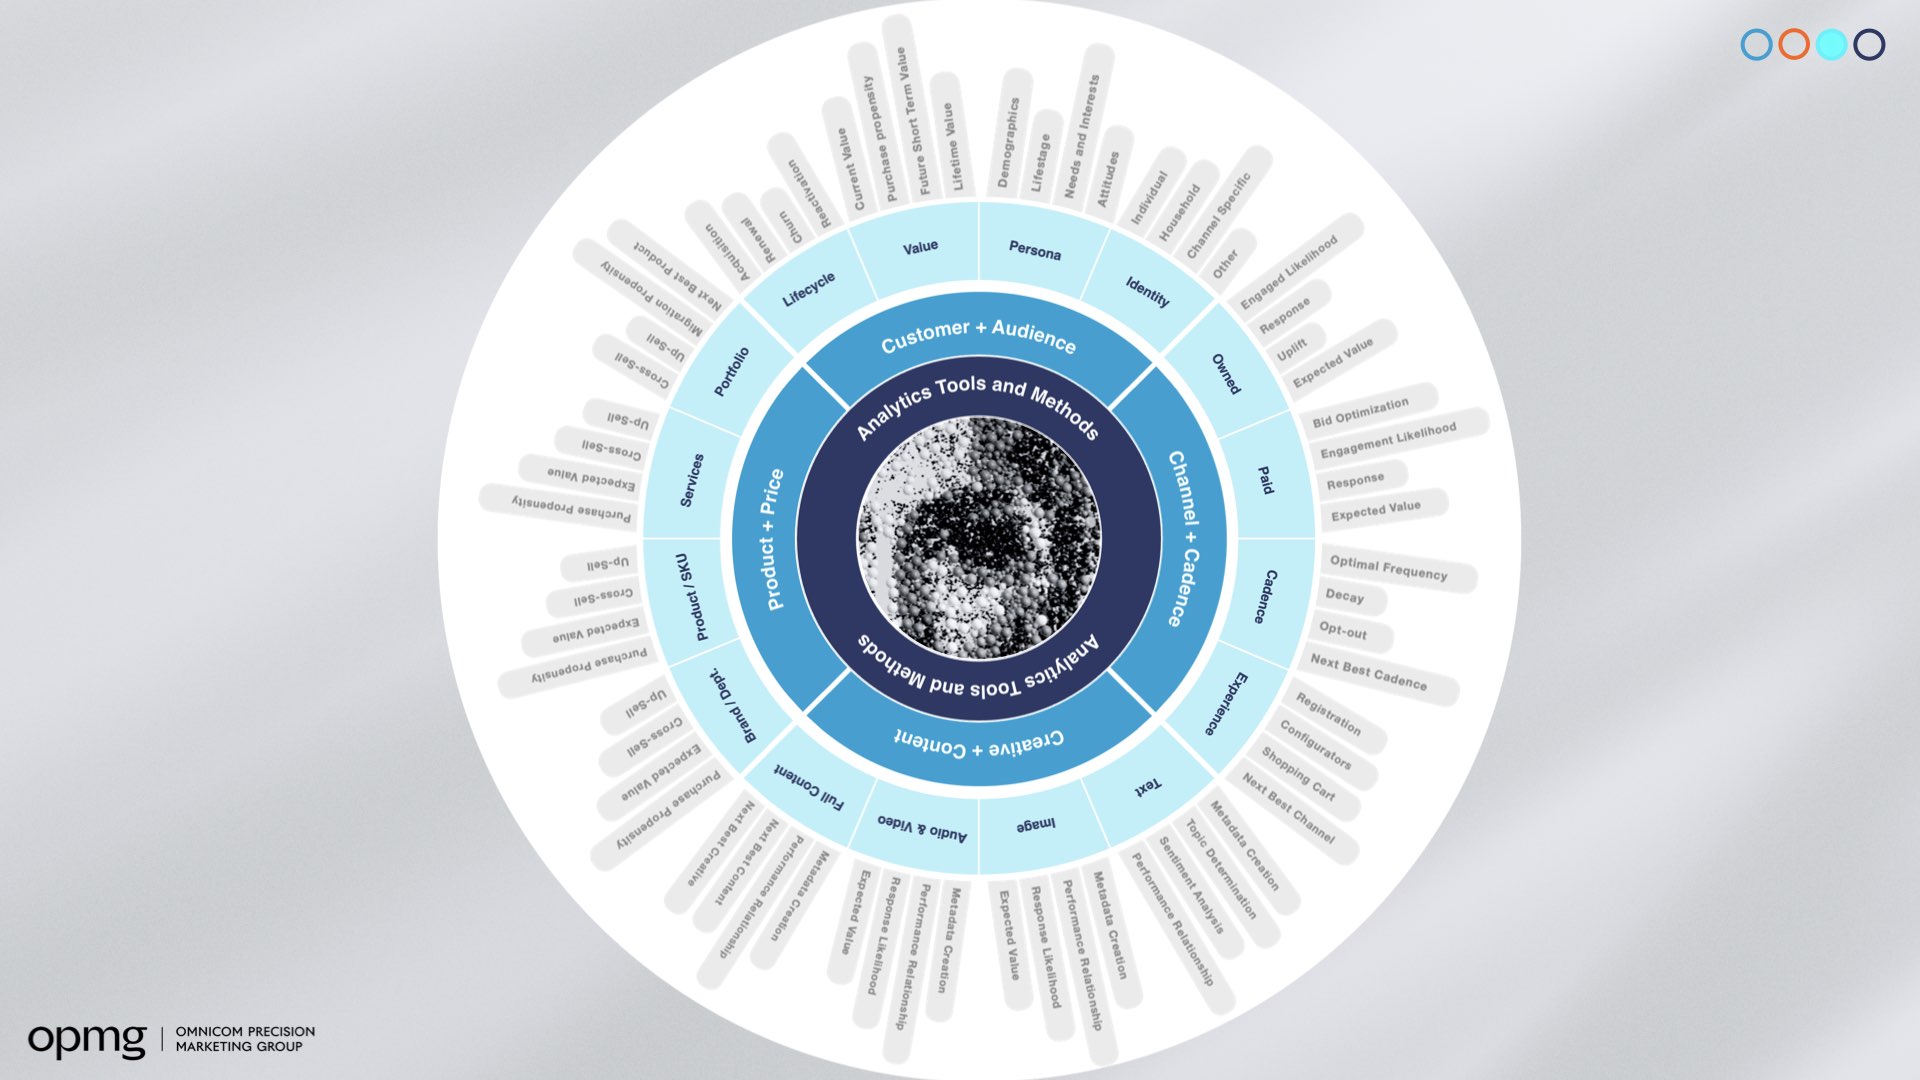
- Audited OPMG’s signal taxonomy and frameworks to unify language across analytics, media, and creative teams
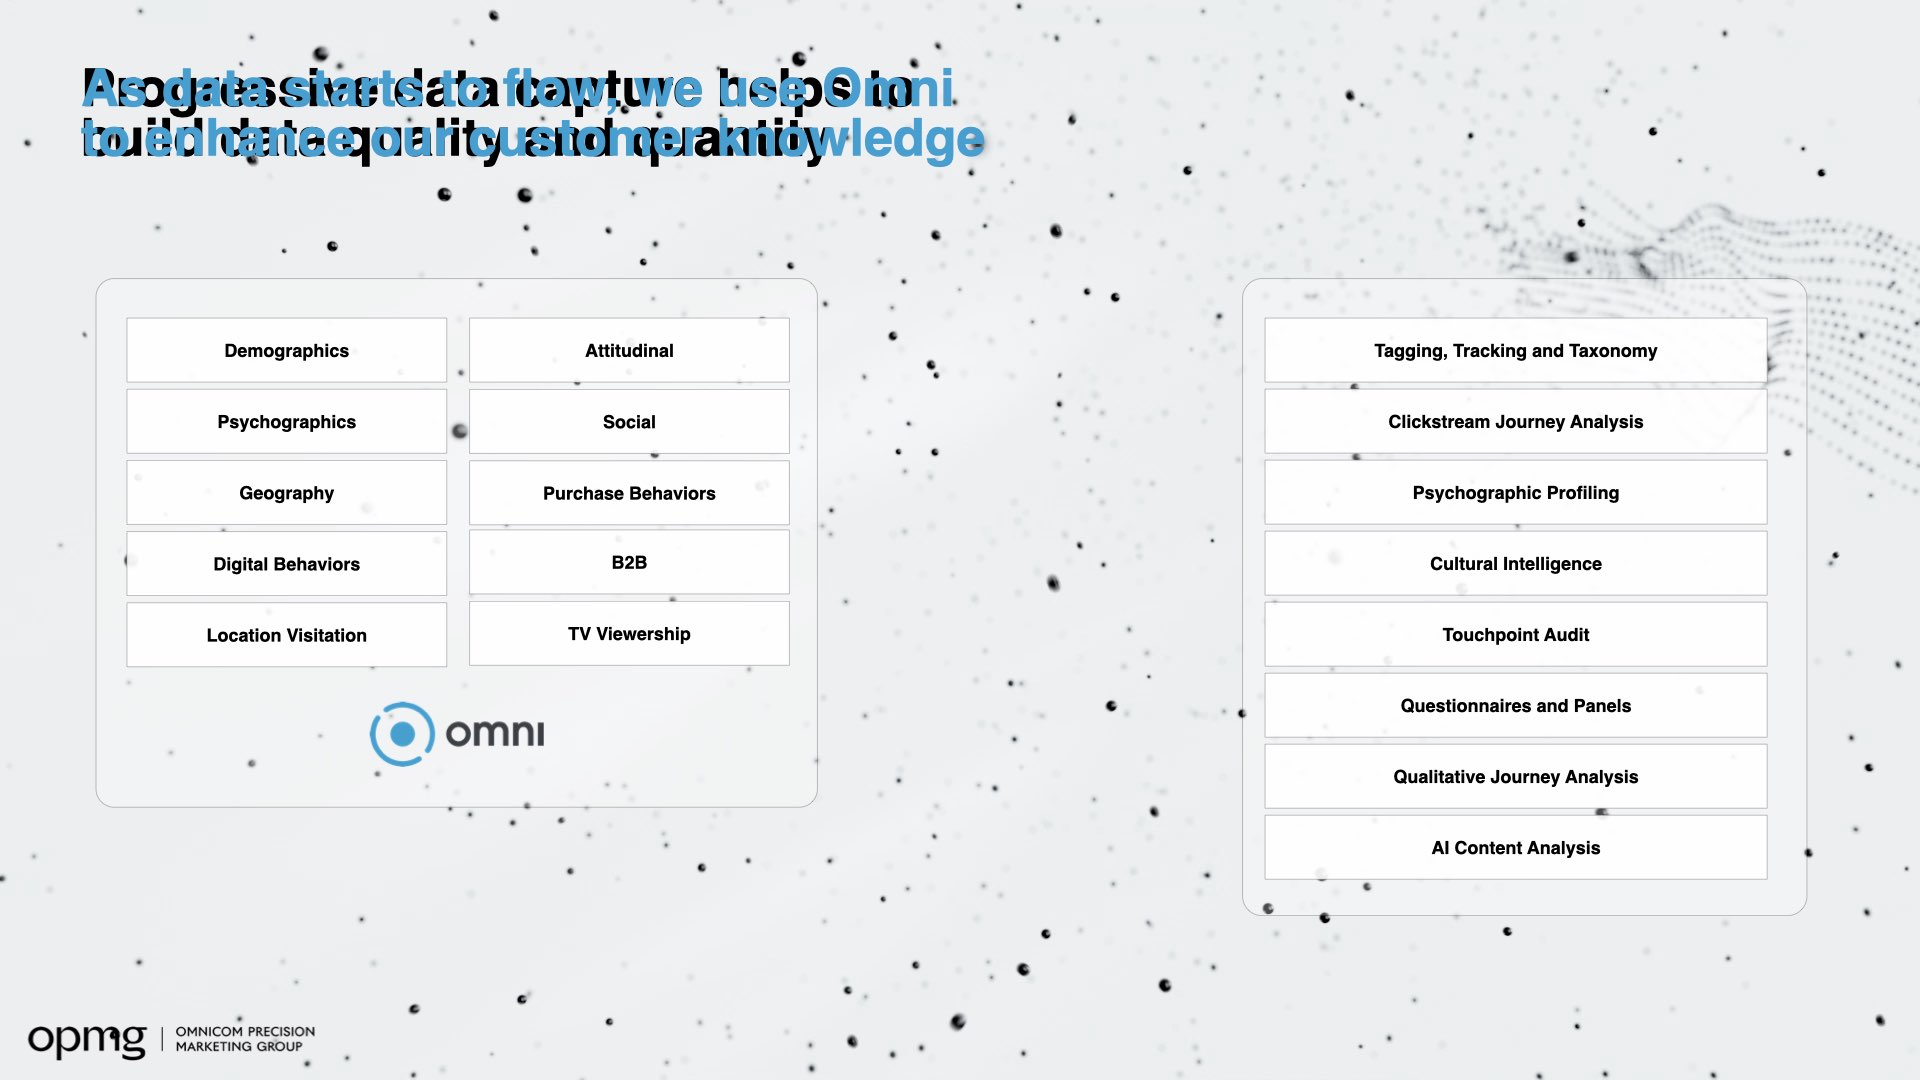
- Designed a layered “data journey” showing how first-, second-, and third-party data is captured, modeled, and activated
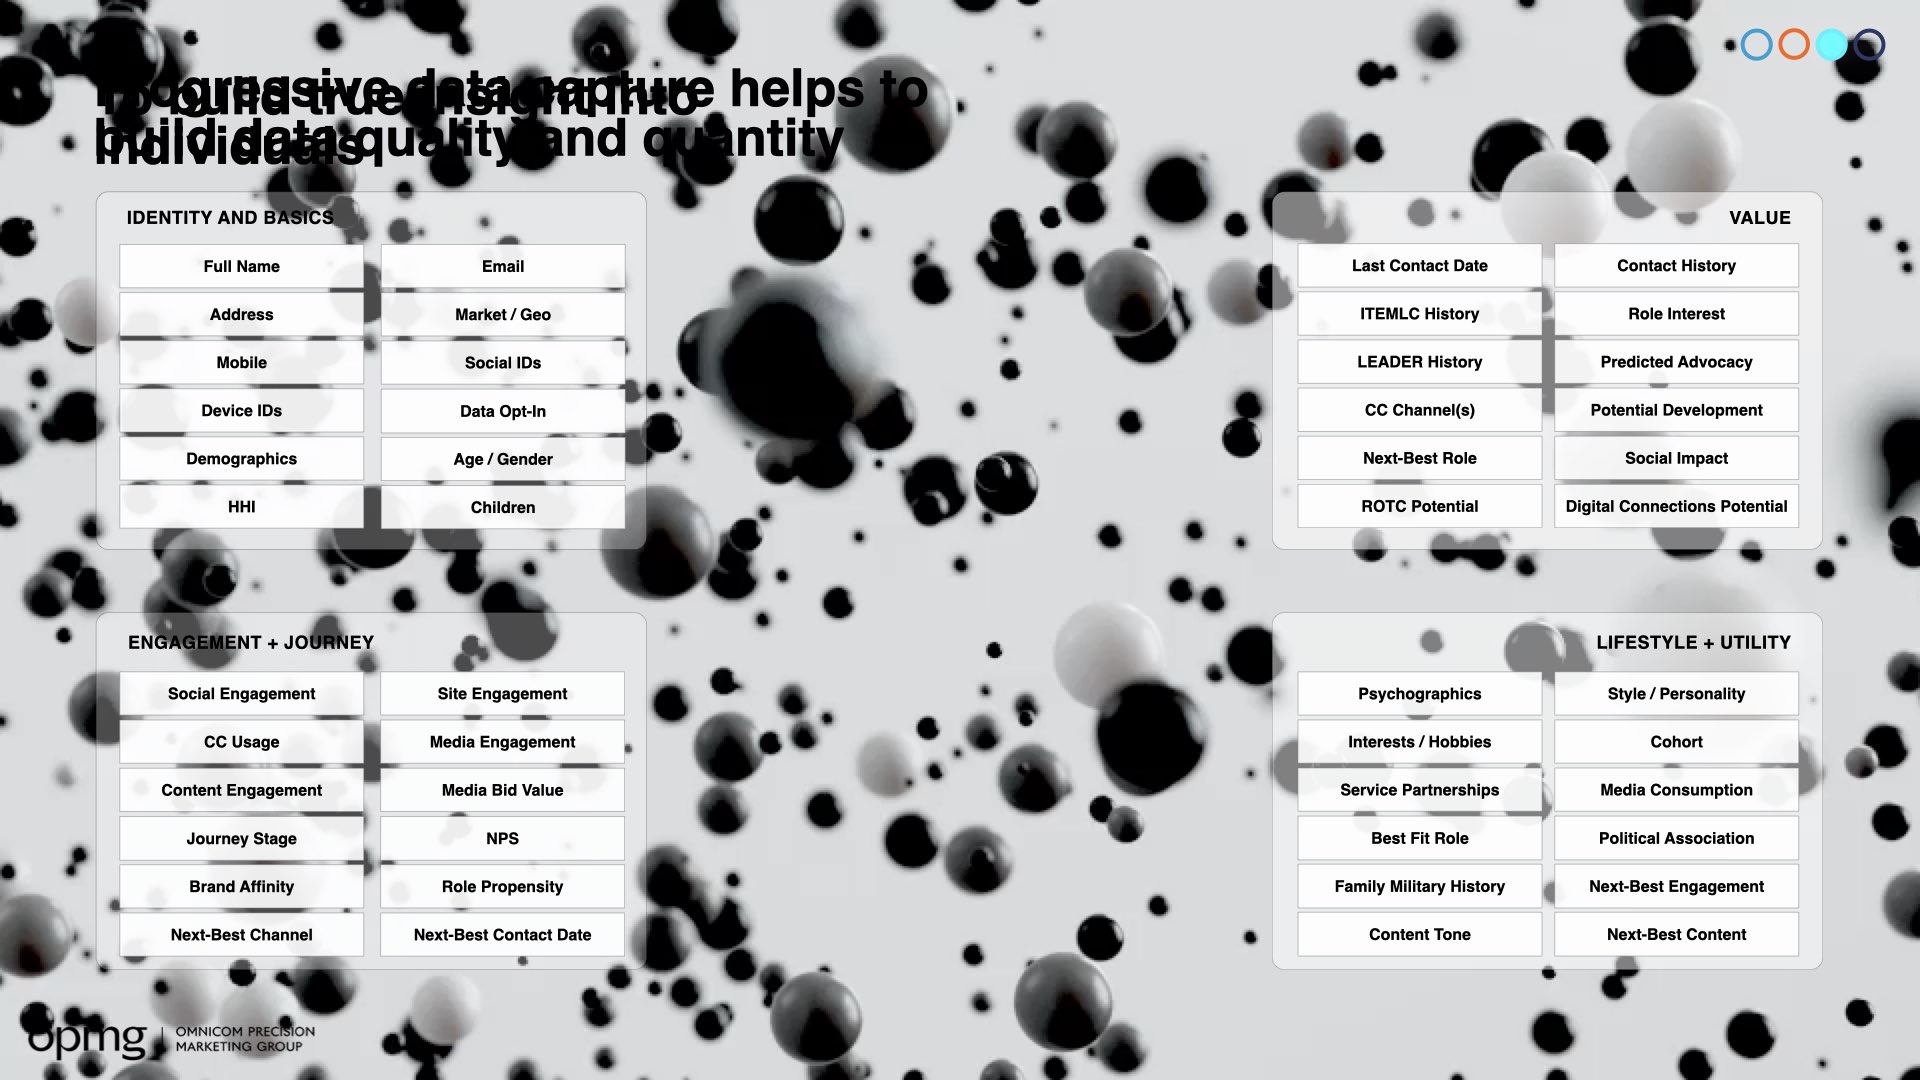
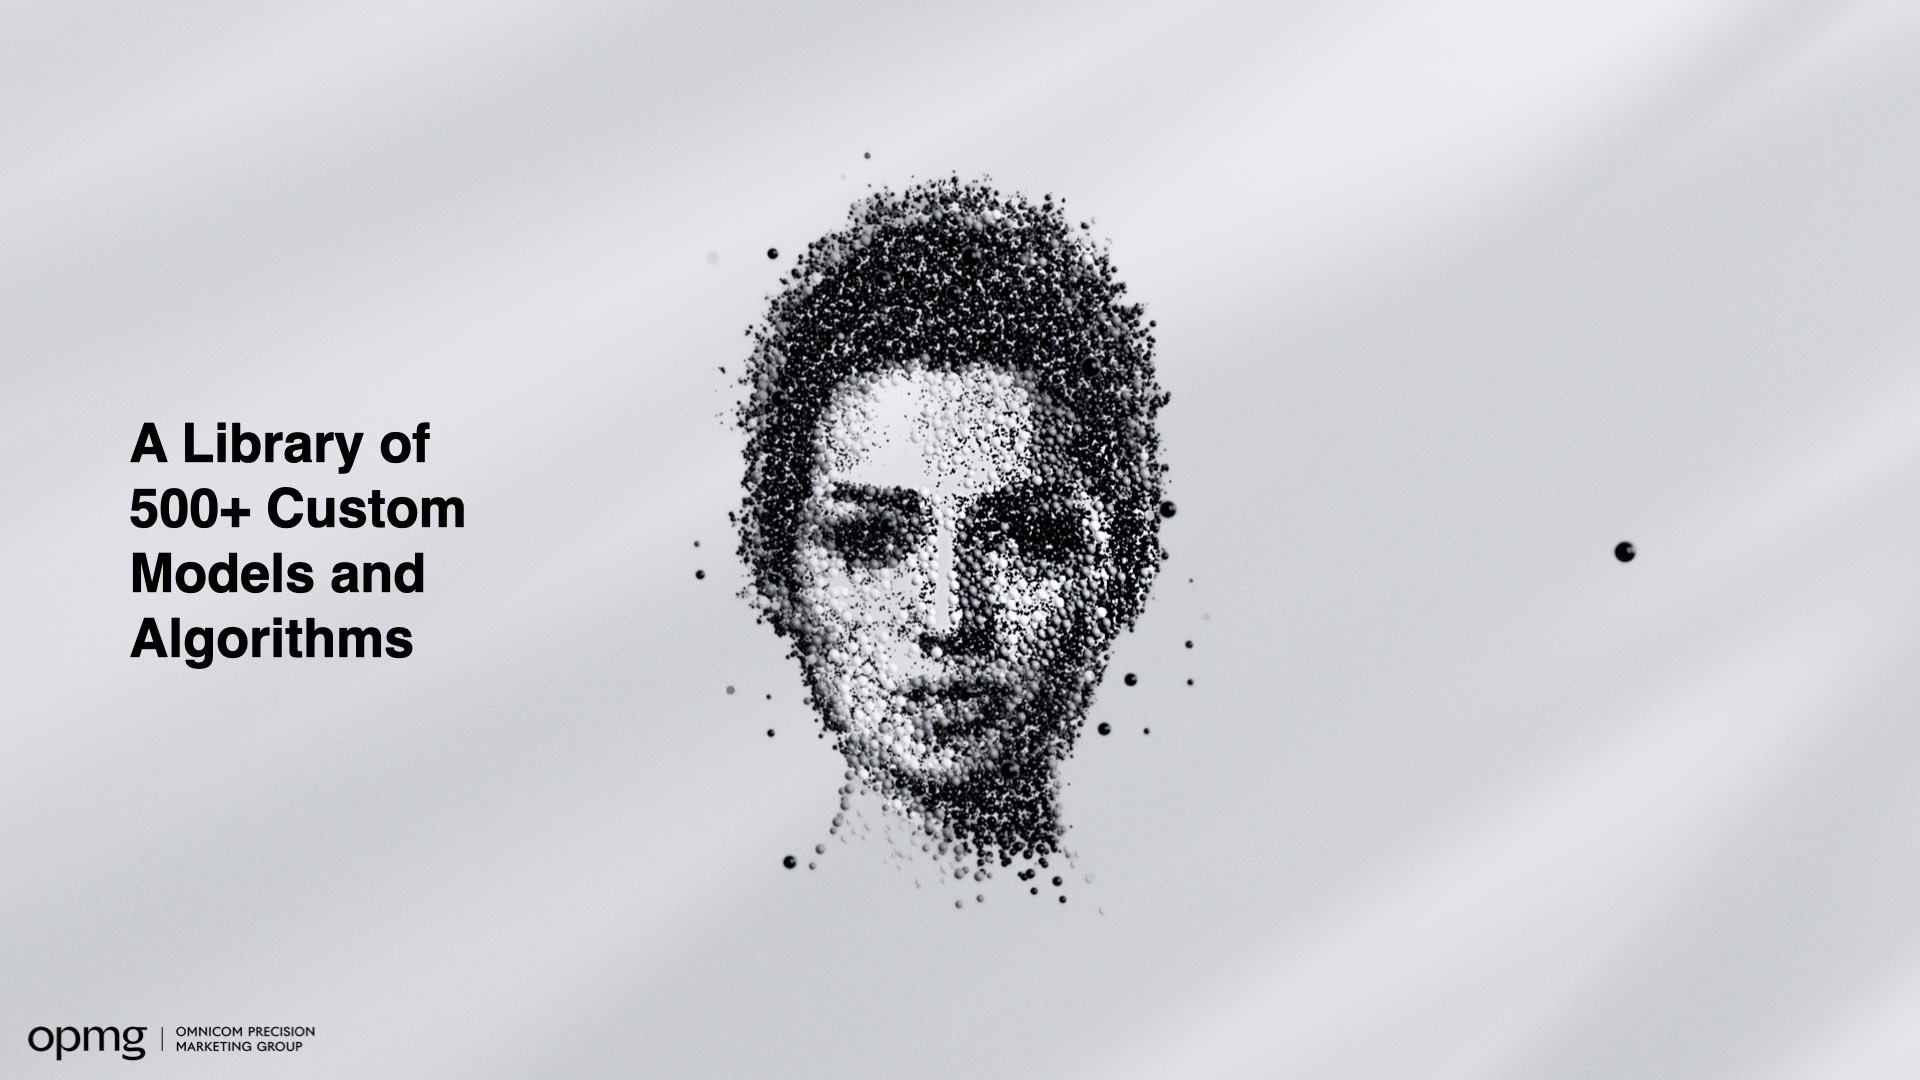
- Created a “signal grid” metaphor to visualize how deeper data drives +30%, +50%, +100% performance lifts
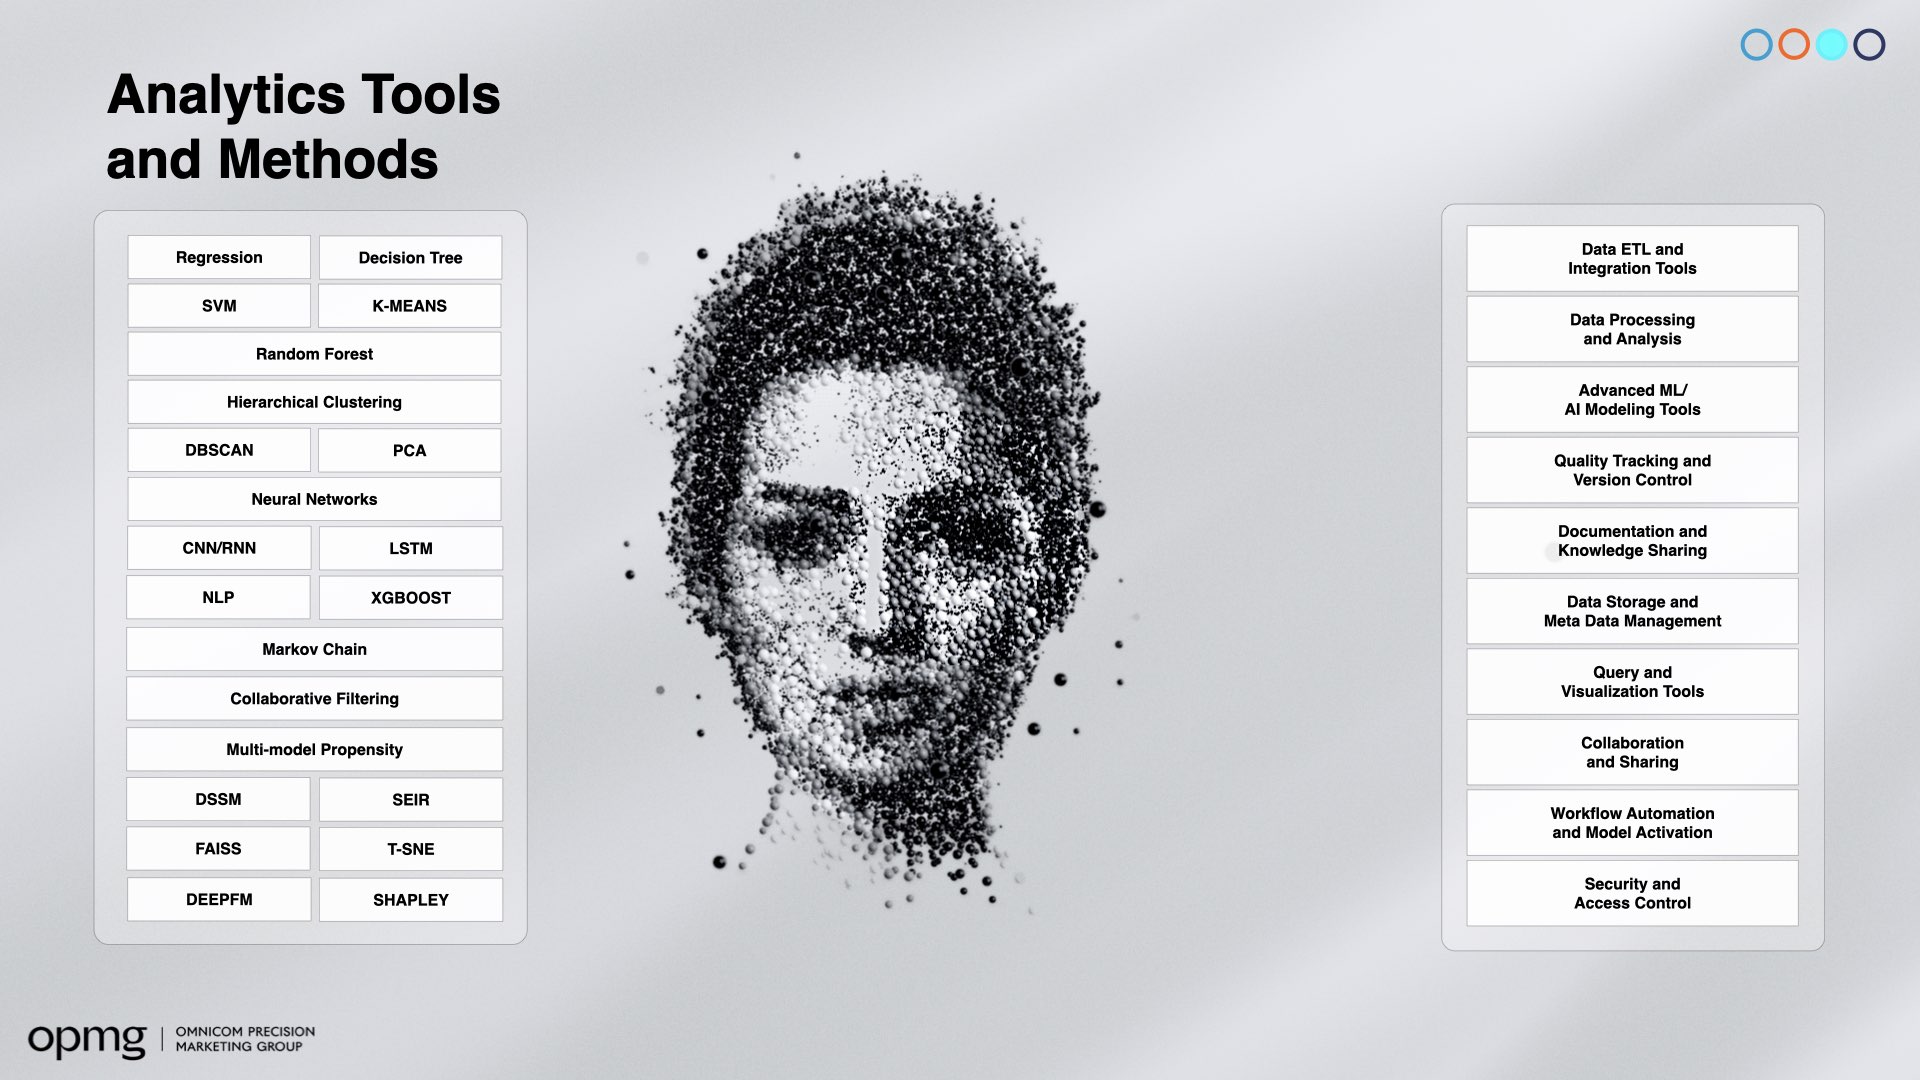
- Grounded strategy in real use cases like lead scoring, personalization, and pathing models to connect theory to outcomes
The Outcome
- Helped align senior leadership across creative, data, and media
- Visuals became a foundational part of OPMG’s 2025 strategy comms
- Created a reusable visualization system for future client pitches and training
- Transformed complex signal architecture into executive-aligned storytelling
More case studies.
If you liked what you've seen, here are a few more you might be interested in!

RAPP New Business Pitch Deck for Spectrum Enterprise
A structured immersion deck built to align Spectrum Enterprise and RAPP on strategy, clarify brand opportunities, and spark B2B growth through clear storytelling.

Desiging the YouTube Content Strategy 2025 Deck to be presented to C-Suite
From content chaos to brand storytelling harmony, I helped Marriott’s Luxury Group elevate their YouTube strategy with a data-backed, halo-effect approach across all sub-brands.
Designing an engaging Sustainability Strategy Workshop for a huge Energy Brand
A sleek, future-forward keynote for Chevron’s New Energies team—bridging innovation, clarity, and climate goals.
This is what happens when clients go all in.
The work only works when the chemistry does. If you’re looking for a creative partner who’s strategic, collaborative, and not afraid to push things further—let’s talk.